

A simple framework to put a number on lengthy waits – lost clients, personnel time and complaints – and to estimate the return on a queue management system.
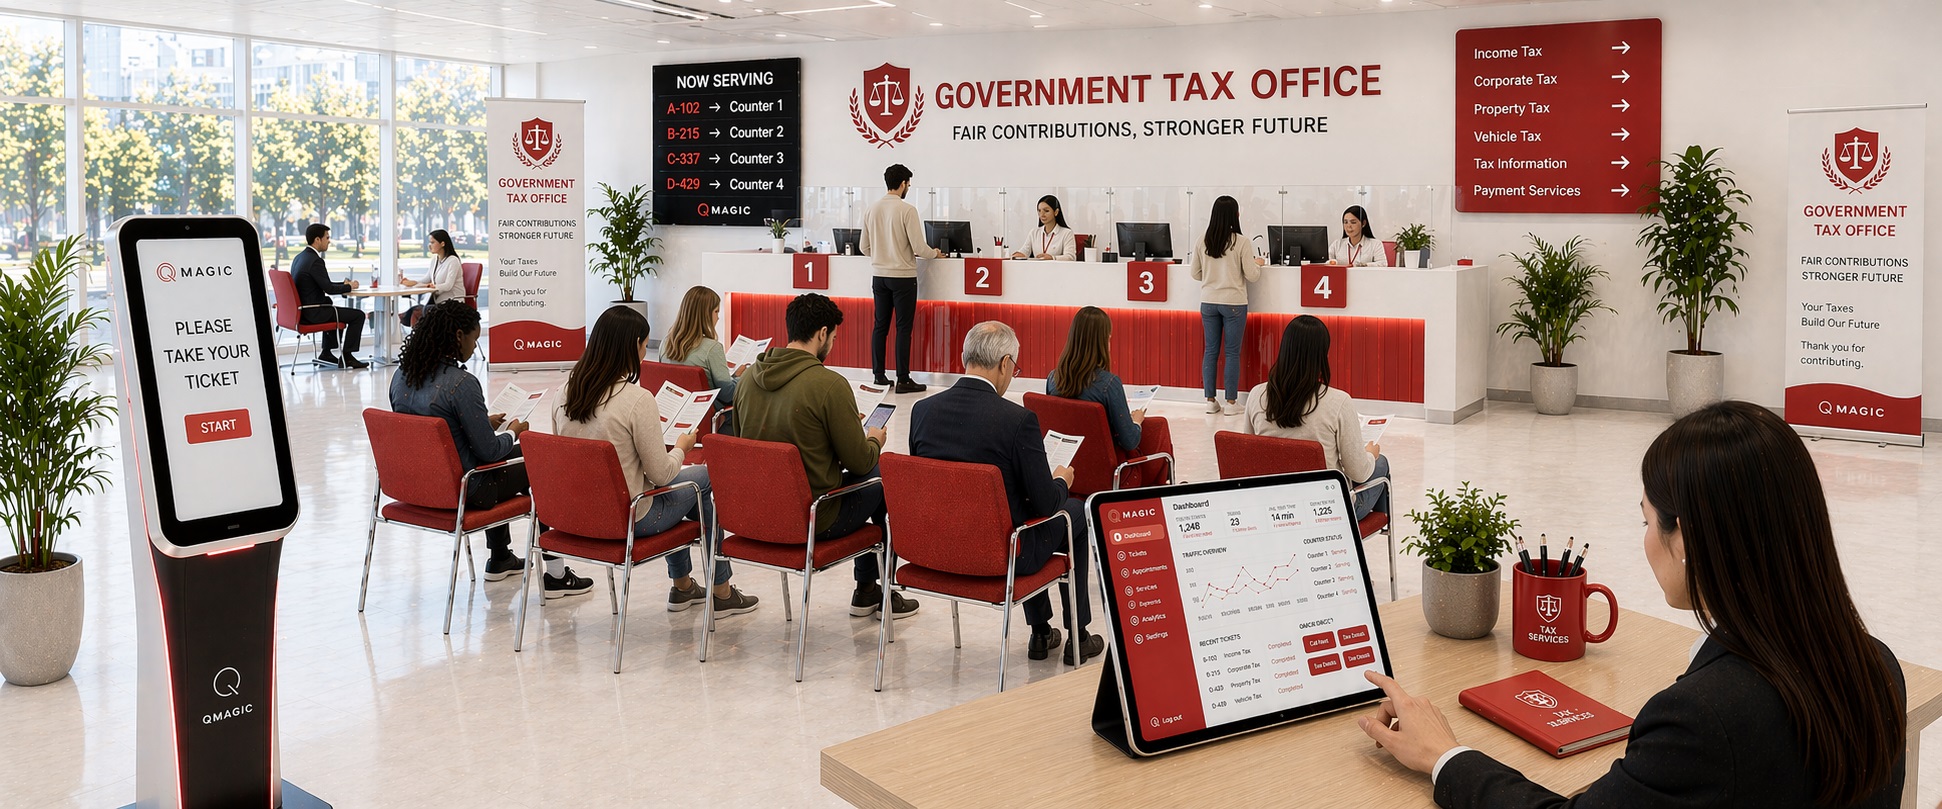
Lengthy queues have a cost even when nobody sends an invoice for it. Clients walk out, team spend time managing crowds rather than serving, and complaints take management time. Putting a number on that cost is the best way to decide how much to invest in a queue management system – and to prove afterwards that it paid off.
Step 1: Count the individuals who leave
Walk-outs are the most direct loss. In a queue system they appear as tickets that were taken but never served. Multiply them by the value of a visit:
- Retail and telecom: average basket or contract value.
- Banking: value of the product the customer came for, or the cost of a lost relationship.
- Healthcare and government: the cost of a repeat visit and a rebooked slot.
Example: 25 walk-outs per day × 250 working days × an average value of USD 40 = USD 250,000 per year walking out of the door.
Step 2: Price the team time lost to crowd management
Without a system, somebody normally directs visitors, answers “how long will it take?” and calls names. Estimate the hours per day spent on this, multiply by the hourly cost of the person doing it. Calling by number on counter and main displays, with automatic spoken announcement, frees most of that time.
Step 3: Look at idle counters
Unbalanced queues waste capacity: one counter has a crowd while another waits for work. Intelligent routing sends the next visitor to whichever qualified counter is free. Even a 5–10% gain in counter utilisation can mean one less counter needed at peak, or numerous more visitors served with the same team.
Step 4: Add the cost of complaints and reputation
Complaints about waiting take time to answer and frequently end up online. You can estimate this as hours spent per complaint × number of complaints, plus a judgement on the reputational cost. Collecting feedback right after service presents whether complaints fall after the system is introduced.
Step 5: Compare with the investment
Add up the yearly cost of the steps above and compare it with the cost of the system: kiosks, displays, software licences, installation and support. For most crowded locations the payback period is measured in months, not years. If you are replacing an older system – for instance moving from QVista to QVista – ask us which existing hardware can stay in use.
Measure before and after
The strongest ROI case uses your own data. Run QVista for several weeks and look at wait time, walk-outs, service time and utilisation per branch, next compare with the targets you set. Use the wait-time calculator to see how many counters you really need at every hour.
Want help building the numbers for your own sites? Talk to our team – we will help you put together a realistic business case.
You may also like

6 Queue Management KPIs Every Service Manager Should Track
Average wait time, service level, handling time, abandonment, utilisation and satisfaction – what they mean and how to use them.
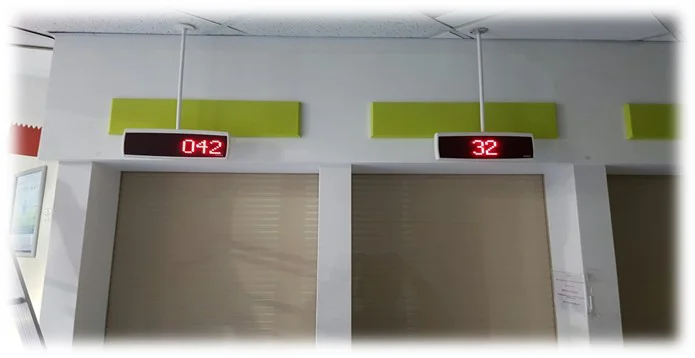
Queue Psychology: 8 Ways to Make Waiting Feel Shorter
Why a 10-minute wait can feel like 30 – and eight hands-on ways to make waiting feel shorter, fairer and calmer in any service hall.
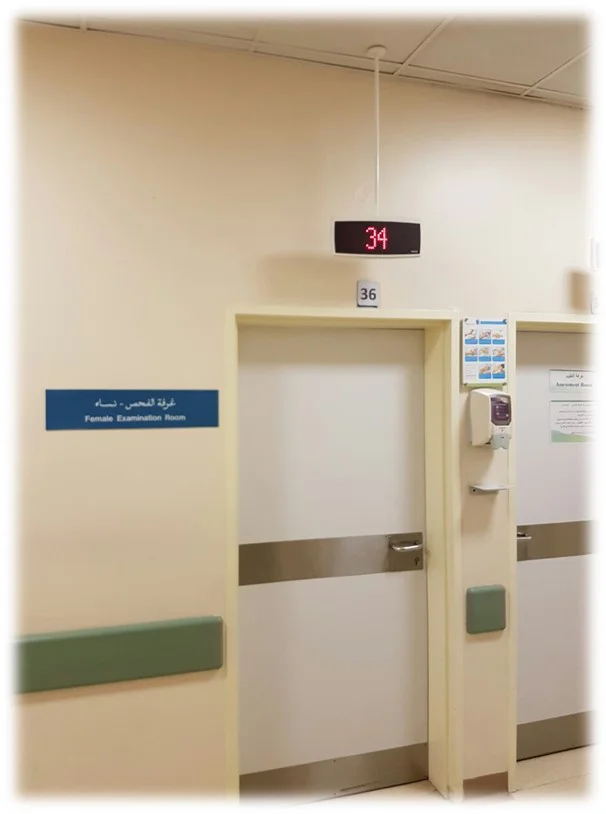
Queuing Theory for Service Managers: Little’s Law and Erlang C in Plain English
The two formulas behind every queue – Little’s Law and Erlang C – explained without the maths jargon, with worked examples for sites and medical centres.